Charting the Path to Data Science and Analysis
By Kannan Sankaran
TOPICS
- LOOKING AT THE BIG PICTURE
- GETTING A SWEET TOOTH WITH NUMPY
- RIDING WITH PANDAS AND MATPLOTLIB
- SINKING DEEP WITH MACHINE LEARNING
THE BIG PICTURE
Suppose you own a nice website, and are asked questions like:
- How many people are visiting your site?
- Which countries are they from?
- How did they get to your website?
- How many Twitter/Facebook followers do you have?
...
and you make this fancy dashboard...
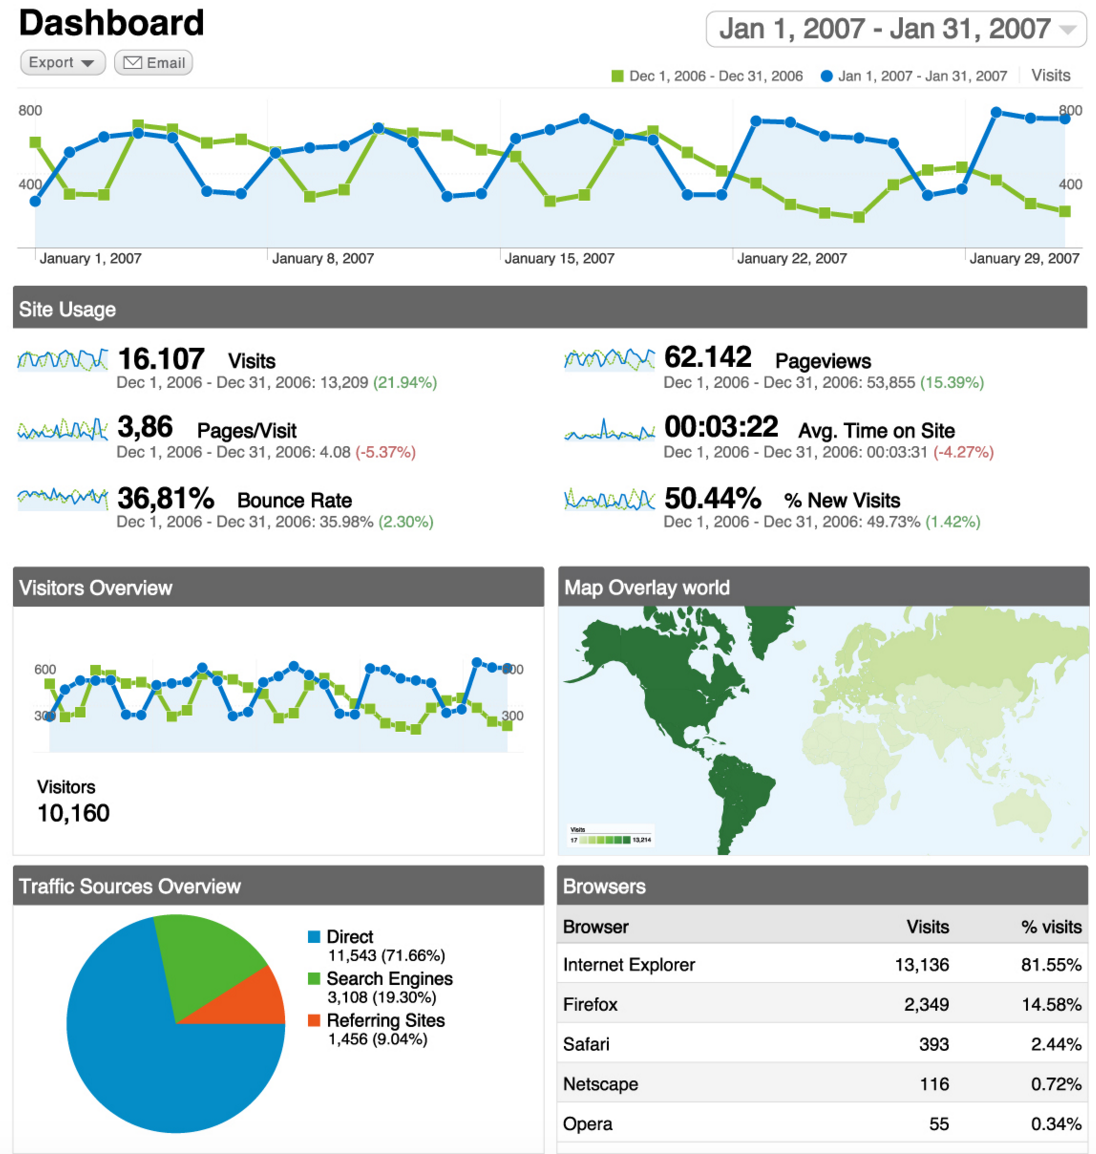
What did you do to make that dashboard?
I PRESUMED YOU WOULD ...
You now have the answers:
- 10,000 people are visiting your site.
- They are from 15 countries.
- They came from Google searches, other websites like ...
- 5000 Twitter followers, 2000 Facebook followers.
What if the site gets super popular, and your data gets bigger and bigger?
And your boss says that he needs further insights to really understand the customers better?
You start collecting data from everywhere.
- Click stream data - to learn the sequence of clicks by someone
- Customer support data - to understand how customers are reacting
- Facebook posts and Twitter feed data - to analyze what people are saying
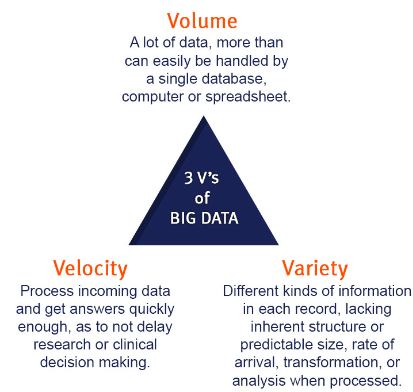
You have also heard about big data and start reading about it on Wikipedia...
Big data - extremely large data sets that may be analyzed computationally to reveal patterns, trends, and associations, especially relating to human behavior and interactions.
... and start wondering
How do I do all this?
Well, you have just become too curious and need to start learning and doing Data Science.
So what is Data Science?
Simply put...
- Gather DATA - large or small.
- Use SCIENTIFIC TECHNIQUES AND METHODS to analyze, summarize, predict, and derive insights from this maze of data.
DATA SCIENCE HISTORY
- 1960 - Computer Scientist Peter Naur used the term Data Science instead of Computer Science
- 1997 - Statistician Jeff Wu gave a talk on "Statistics = Data Science?"
- A Trilogy of Data Collection, Data Modeling, and Data Analysis - 2008 - DJ Patil (formerly at LinkedIn, now Chief Data Scientist at White House, and Jeff Hammerbacher (formerly Facebook, now founder/Chief Scientist of Cloudera) coined the term "Data Scientist".
Wikipedia - Data Science utilizes data preparation, statistics, predictive modeling and machine learning to investigate problems in various domains such as agriculture, marketing optimization, fraud detection, risk management, marketing analytics, public policy etc.
NUMPY, PANDAS, MATPLOTLIB, AND SCIKIT-LEARN ARE THE MOST POPULAR PYTHON LIBRARIES USED AND THE BUILDING BLOCKS FOR DATA SCIENCE AND ANALYSIS, AND WE WILL GET A FEEL FOR EACH.
SO PLEASE HOLD YOUR HORSES. :)
GETTING A SWEET TOOTH WITH NUMPY
Thanksgiving sweets
(Non-traditional :))


How much does each person pay?
# WITH A FOR-LOOP
def getTotalPrice(itemPrices, quantities):
   totalPrice = 0
   for i in range(0, len(itemPrices)):
      totalPrice = totalPrice + itemPrices[i]*quantities[i]
   return totalPrice / 100.0

itemPrices = [30, 50]  # 1 Turkey costs 30c, 1 Cream puff - 50c

kannanQuantities = [2, 1]  # Kannan has 2 Turkeys, and 1 Cream puff
romanQuantities =  [5, 0]  # Roman has 5 Turkeys, and 0 Cream puffs
davidQuantities = [0, 15]  # David has 0 Turkeys, and 15 Cream puffs

print "Kannan: $" + str(getTotalPrice(kannanQuantities, itemPrices))
print " Roman: $" + str(getTotalPrice(romanQuantities, itemPrices))
print " David: $" + str(getTotalPrice(davidQuantities, itemPrices))
# WITH NUMPY
import numpy as np

itemPrices = np.array([30, 50])  # Turkey - 30c, Cream puff - 50c

# Items are arranged in rows
items = np.array([[2, 1], [5, 0], [0, 15]])

totalPrice = np.dot(items, itemPrices) / 100.0

print "Kannan: $" + str(totalPrice[0])
print " Roman: $" + str(totalPrice[1])
print " David: $" + str(totalPrice[2])
Why NumPy?
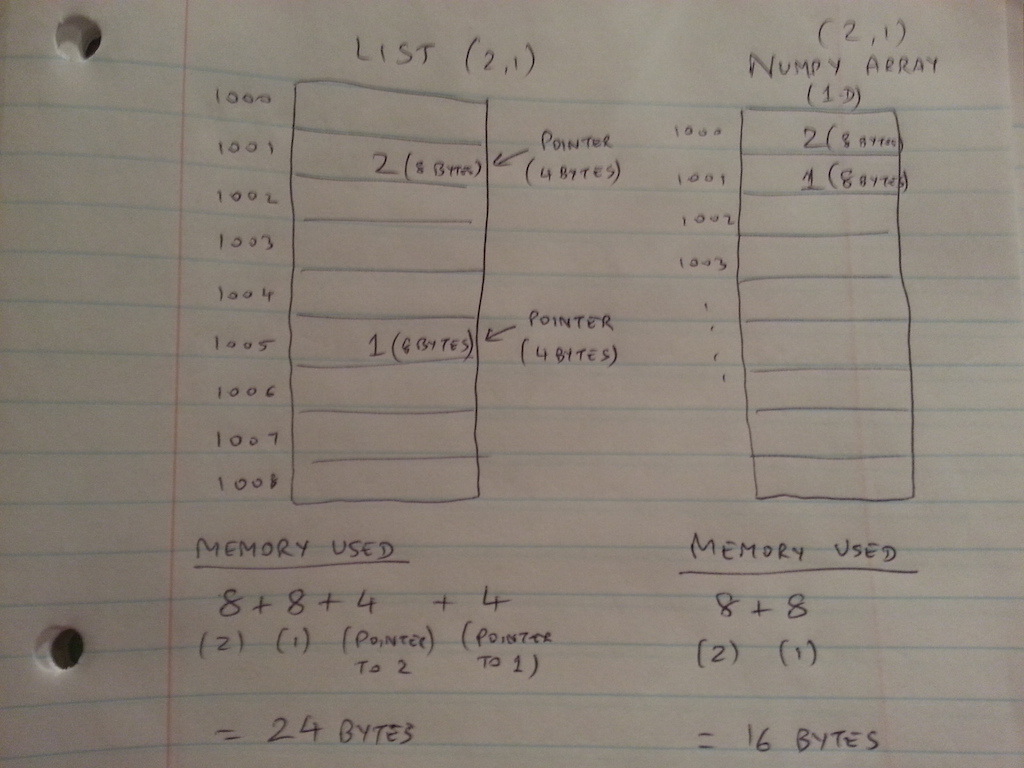
WHAT IS NUMPY?
Numerical Python (NumPy) - An important Python package for high performance scientific computing and data analysis.
NUMPY FEATURES
- ndarray - a fast and space-efficient multidimensional array object
- Fast computation, no need to write for-loops
- Provides standard mathematical functions and vectorized arithmetic operations
- Linear algebra and random number generation capabilities
- Reading / writing array data to disk and working with memory-mapped files
Continued in IPython Notebook...
RIDING WITH PANDAS AND MATPLOTLIB
PANDAS
A very popular Python library that offers data structures and operations for manipulating numerical tables and time series.
MATPLOTLIB
A very popular Python library for plotting graphs and charts.
PANDAS OFFERS 2 IMPORTANT DATA STRUCTURES:
- SERIES - A 1-dimensional object similar to an array, list, or column in a table.
- DATAFRAME - A DataFrame is a data structure similar to a spreadsheet (rows and columns). It can hold columns of different data types.
Continued in IPython Notebook...
SINKING DEEP WITH MACHINE LEARNING
AMAZON PRODUCT RECOMMENDATIONS

NETFLIX MOVIE RECOMMENDATIONS

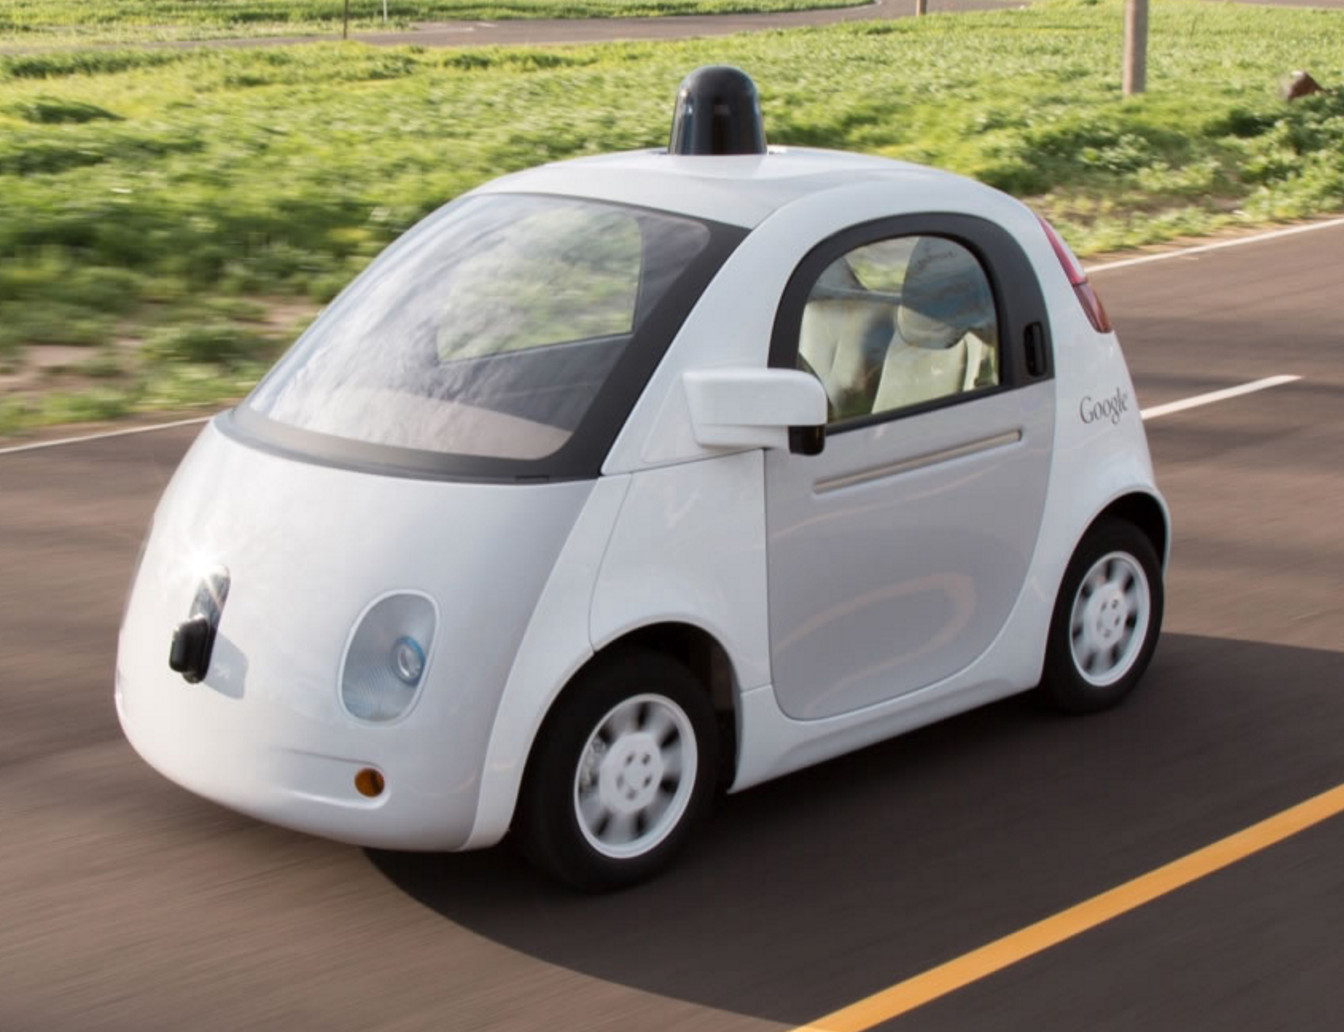
GOOGLE SELF DRIVING CAR
WHAT IS MACHINE LEARNING?
Machine learning is a type of artificial intelligence (AI) that provides computers with the ability to learn without being explicitly programmed.
Machine learning in an integral component of Data Science,
and is super hot right now.
WHAT IS MACHINE LEARNING?
- SUPERVISED LEARNING - The program is explicitly trained on the input and corresponding output.
- UNSUPERVISED LEARNING - The program tries to find an underlying structure and pattern in the data.
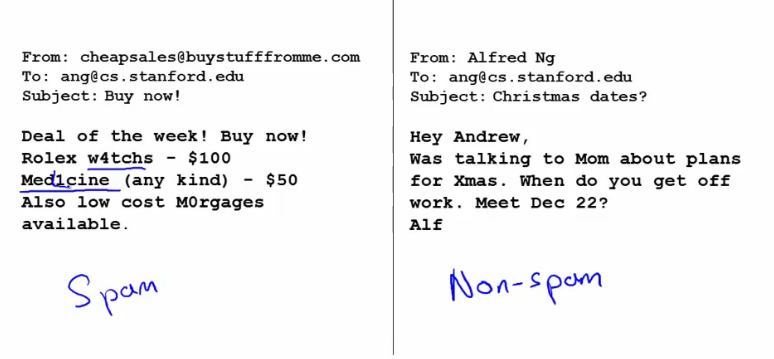
SUPERVISED MACHINE LEARNING - CLASSIFICATION
The machine is taught to classify objects. Each of the classification results is an output label.
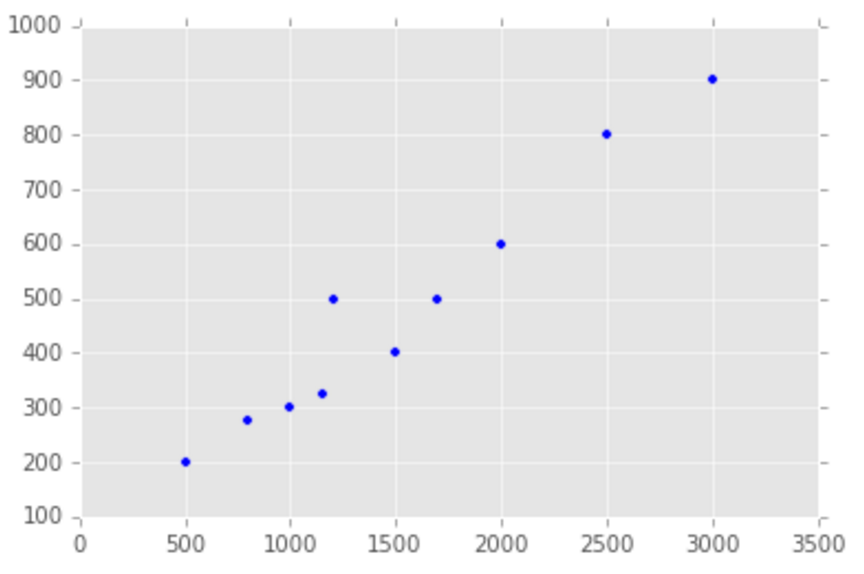
SUPERVISED MACHINE LEARNING - REGRESSION
The machine is taught to identify the relationship between the value of variables.
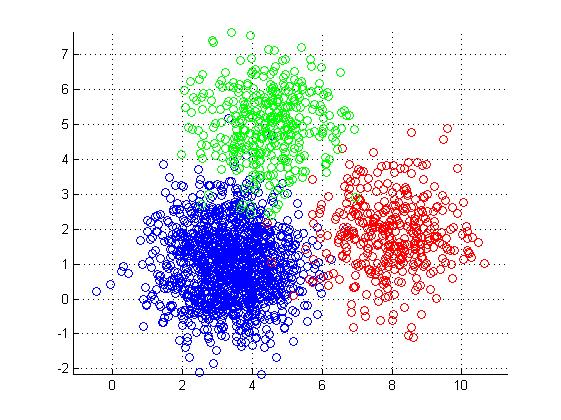
UNSUPERVISED MACHINE LEARNING - CLUSTERING
The machine is not trained, and tries to figure out some underlying pattern that can be labeled by a human.
WHAT IS SCIKIT-LEARN?
A very popular Python library used for building both Supervised and Unsupervised Machine Learning models.
SUPERVISED MACHINE LEARNING STEPS
- Load the data.
- Visualize it.
- Determine the features.
- Split into training and test data.
- Use Scikit-learn to build a model and predict
- Plot and evaluate model.
THE END - HOPE IT WAS USEFUL!
![]()